Prevalence
The prevalence of dead zones is heavily linked to the expansion and advancement of the human environment. Eutrophication is the main cause of dead zones, which are influenced by human activity such as agriculture and the development of wastewater sewage systems. Although dead zones can occur naturally through climate change and coastal upwelling, it is important to consider how the actions of humans have caused many hypoxic zones to appear. The progression of the human society will forever grow, continuing to put more marine ecosystems at risk.
Dead zones had started to appear during the 1970's, when they were detected in Chesapeake Bay off Maryland, as well as Scandinavia’s Kattegat Strait, the mouth of the Baltic Sea, the Black Sea and the northern Adriatic. These occurrences were discovered by the unusual dying fish populations and the strange algal bloom and nutrient enrichment, signifying the depletion of dissolved oxygen. This had hinted at mankind's impact, because it had coincidentally occurred around the time industrialization had started, creating a lot of pollution and increasing the amount of phosphorus being inputted into the waters. All of these events had amplified the rate of algal blooming, ultimately causing dead zones.
Dead zones are only going to occur more frequently according to statistics. In the past twenty years, oxygen-depleted areas in the tropical Pacific and Atlantic have expanded significantly in size, and the number of global oceanic dead zones has increased significantly. In 2003, there were about 146 dead zones in the world's oceans and that amount had increased to 405 in 2008. This showed the sudden development of agricultural practices around oceanic areas As time passes, more agricultural land are formed and other sources that cause eutrophication continue to appear. The drastic increase of the amount of dead zones in the world in that period of time suggests that chemical agriculture poses a threat to marine life as overfishing and habitat-loss.
The size of dead zones had also changed remarkably. When dead zones were first discovered in 1970, the size of them did not concern people much, because they were only capable of wiping out small populations of fish and the impacts of this on the human economy did not seem significant. However, in 2003-2005 the largest dead zone was recorded at about 30000 square kilometers, which was enough to destroy fish populations and ruin beaches with the overwhelming amount of toxic algae. In 2008, the largest dead zone recorded covered an area of approximately 70000 square kilometers, which was over twice the size of the previous one, in a period of about 5 years. These statistics show how the prevalence of dead zones are increasing faster than ever.
Michele McKay.
(2014). Ocean "Dead Zone" Solution: Buy
Organic!.Available:
http://www.downtoearth.org/environment/organic-vs-conventional-farming/ocean-dead-zone-solution-buy-organic.
Last accessed 26th Mar 2014.
Robert Simmons. (2012). What Causes 'Dead Zones'.
Available: http://www.scientificamerican.com/article/ocean-dead-zones/. Last
accessed 25 March 2014.
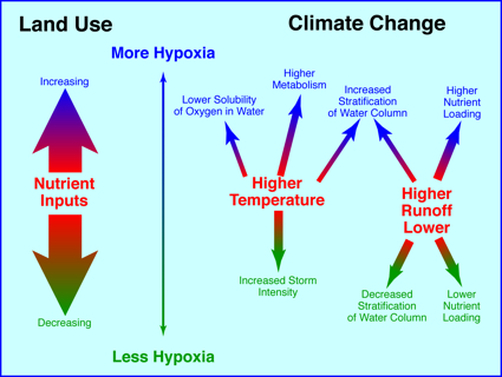
Figure 24:
Figure 24 is a diagram showing how land use and climate change affects the prevalence of dead zones. When land use decreases, it reduces the amount of nutrient inputs such as phosphorus, causing less hypoxia. It is shown that dead zones are occur less if there is lower temperature and lower runoff and higher chances of hypoxia if there is higher temperature and higher runoff.
http://www.vims.edu/research/topics/dead_zones/climate_change/index.php.
VIMS. (2014). Dead Zones and Climate Change. Available: http://www.vims.edu/research/topics/dead_zones/climate_change/index.php. Last accessed 26th March 2014.
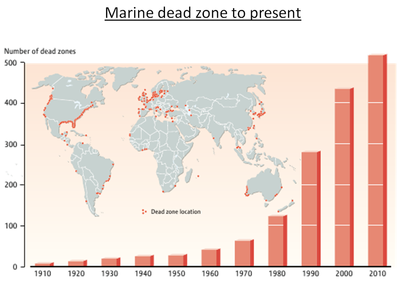
Figure 25:
Figure 25 is a grpah showing the increase of the amount of dead zones over time, and in the background shows the locations of the dead zones. As depicted in the graph, from 1910 to 1970, there only about 10-100 dead zones in the world. From 1980 to 2010, there is a drastic increase in the amount of dead zones, increasing from about 100 to over 500. This sudden change shows that it may be linked to the large number of agricultural practices and industrialisation.
sybil.bory. (2012). marine dead zone to present . Available:
http://www.wrsc.org/attach_image/marine-dead-zone-present. Last accessed 27th March 2014.
